
Impurities in viral-based therapeutics: mastering residual hcDNA: a harmonized approach for AAV gene therapies
Cell & Gene Therapy Insights 2025; 11(9), 1107–1123
DOI: 10.18609/cgti.2025.127
AAV gene therapy products are produced in continuous cell lines which can leave host cell DNA (hcDNA) in the final product, posing potential risks to patient safety. Regulatory guidelines keep evolving to address these risks, recommending limits on hcDNA levels and fragment sizes. To better control hcDNA impurities manufacturers rely on risk assessments, characterisation and quantitation, and removal strategies.
Based on survey insights, the BioPhorum workstream highlights differences in hcDNA reporting across the industry, proposes a standardized reporting approach by normalizing hcDNA levels to AAV genomes (vg), establishing a reference range for vg-normalized hcDNA level in AAV manufacturing processes. This supports risk assessment and better comparison across gene therapy products.
Holistic manufacturing control strategies for hcDNA are outlined, including optimizing cell line selection, robust purification techniques, and nuclease treatments.
By adopting these harmonized reporting and control strategies, the industry can master hcDNA impurities, ensuring safer gene therapy products for patients.
Introduction
Gene therapy products, particularly those utilizing viral vectors derived from AAV, lentivirus (LV), and adenovirus (AdV), are commonly produced in continuous cell lines (CCLs) (e.g., HEK293, HeLa, PER.C6 and Sf9) [1]Tan E, Chin CSH, Lim ZFS, et al. HEK293 Cell line as a platform to produce recombinant proteins and viral vectors. Front. Bioeng. Biotechnol. 2021; 9, 796991.. These host cells are often used for viral vector production, and residual host cell DNA (hcDNA) can be present as an impurity in the final product, posing potential risks to patient safety [2]US Food and Drug Administration. Characterization and Qualification of Cell Substrates and Other Biological Materials Used in the Production of Viral Vaccines for Infectious Disease Indications. FDA Center for Biologics Evaluation and Research; 2010.. These risks are more prominent for viral vectors compared to other biologics such as antibodies since it is complex to separate the product (viral vector + therapeutic gene) from the vectors containing unwanted hcDNA during the purification process. Monitoring, minimizing and controlling hcDNA is essential to ensure product safety, quality, and regulatory compliance for manufactured viral vectors. Residual hcDNA can theoretically be associated with oncogenes, particularly for AAV produced with human-derived continuous cell lines [3]Temin HM. Overview of biological effects of addition of DNA molecules to cells. J. Med. Virol. 1990; 31, 13–17.. Oncogenicity [4]US Food and Drug Administration. Briefing Document: Vaccines and Related Biological Products Advisory Committee Meeting. Sep 19, 2012. risks arise when hcDNA contains intact genes which have the potential for the induction of cancer, i.e., oncogenes. Infectivity [5]Wright JF. Product-related impurities in clinical-grade recombinant AAV vectors: characterization and risk assessment. Biomedicines 2014; 2, 80–97. risks arise when hcDNA contains viral genomes that could replicate, producing infectious agents. Given these risks, manufacturers must effectively control and quantify hcDNA.
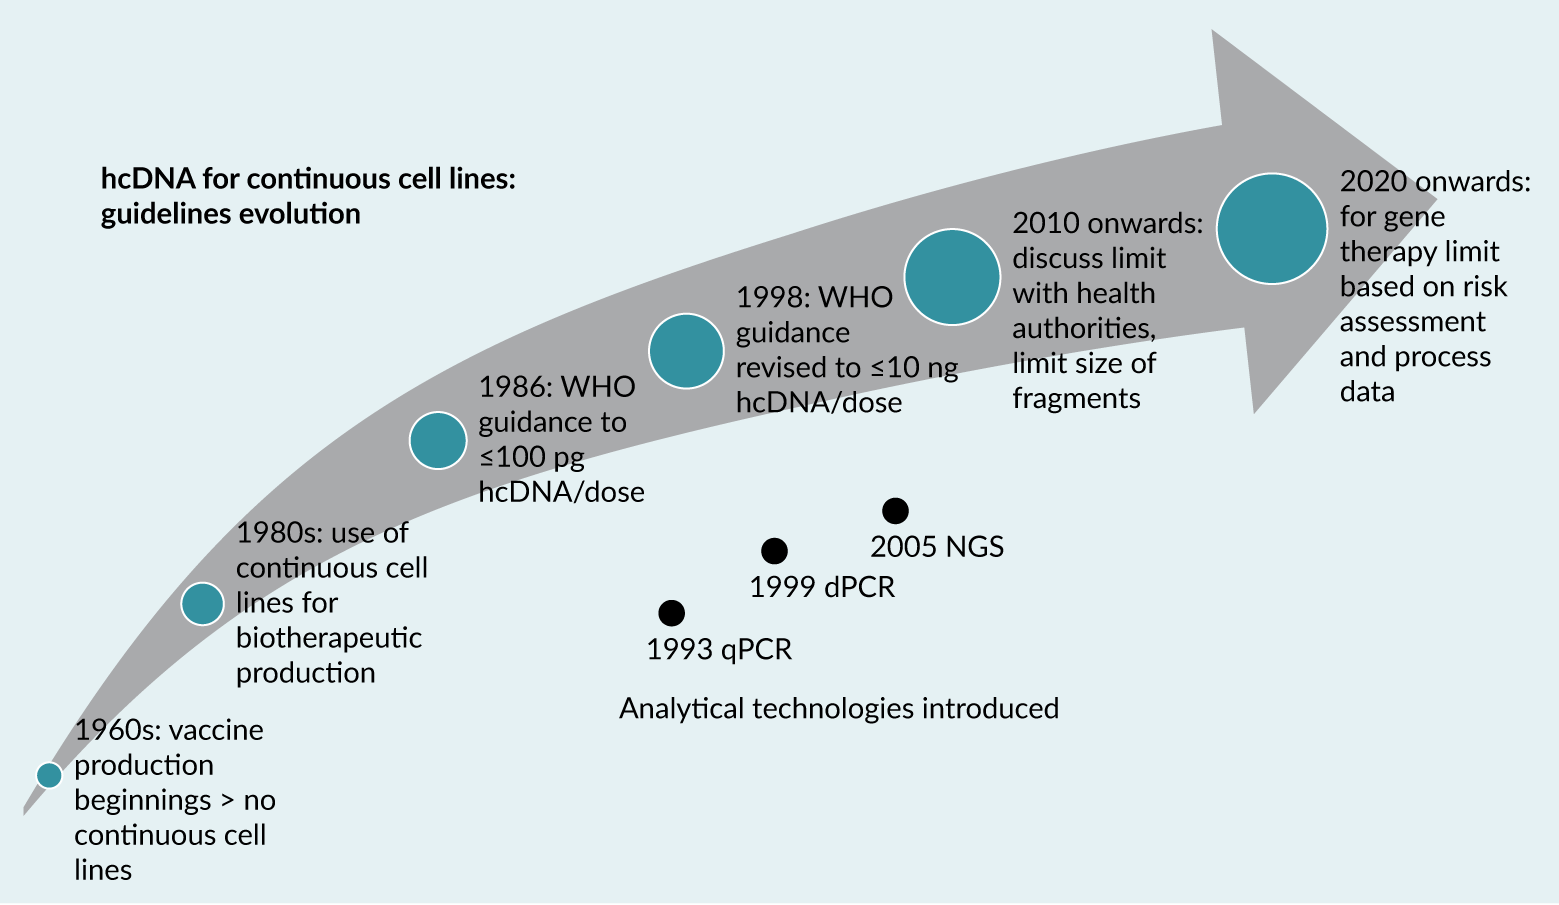
The safety risks associated with hcDNA have led health authorities (HAs) to issue guidelines outlining acceptable levels of hcDNA per dose. These non-binding recommendations have evolved as scientific knowledge and biopharmaceutical capabilities have advanced (Figure 1), adapting to new insights and technologies in gene therapy production. The first recommendation on hcDNA value was given in 1986 by WHO stating that the risk associated with hcDNA in a product is negligible when the amount of hcDNA is 100 picograms (pg) or less per parenteral dose. This threshold was revised in 1998 to increase the acceptable limit to 10 nanograms (ng) per dose [6]WHO. Requirements for the use of animal cells as in vitro substrates for the production of biologicals. Biologicals 1998; 26, 175., reflecting improved understanding and assessment techniques. Another key recommendation is that hcDNA fragments should ideally be a median DNA size of 200 base pairs (bp) or lower to further minimize the risk of functional gene integration, which could contribute to genotoxicity [7]World Health Organization. Annex 3: Recommendations for the Evaluation of Animal Cell Cultures as Substrates for the Manufacture of Biological Medicinal Products and for the Characterization of Cell Banks. Replacement of Annex 1 of WHO Technical Report Series, No. 878, 2013.. It is important to note that guidelines were recommendations only and always emphasized the importance of a risk assessment, taking into account specificities of the product, cell substrate, manufacturing process and size, and quantity and activity of hcDNA. In a guidance published in 2010, the US FDA advised to limit the amount of residual DNA for continuous non-tumorigenic cells to less than 10 ng/dose and the DNA size to below a median of 200 base pairs. Additionally, manufacturers are recommended to test products made in CCLs with known potential oncogenes for those specific oncogenes, e.g., 293T cells for adenovirus E1 and SV40 Large T antigen sequences, similarly products made in Hela cells for E6/E7 genes [8]US Food and Drug Administration. Guidance for Industry: Characterization and Qualification of Cell Substrates and Other Biological Materials Used in the Production of Viral Vaccines for Infectious Disease Indications. FDA Center for Biologics Evaluation and Research, Feb 2010..
| Figure 1. Schematic of the evolution of hcDNA guidelines and analytical technologies. |
|---|
 |
In recent guidance for gene therapies targeting neurodegenerative diseases, the FDA has purposefully not provided guidance on a specific hcDNA threshold, instead encouraging manufacturers to assess the characteristics of their production cell lines, particularly for sequences that might impact patient safety (such as presence of tumorigenic sequences) and limit residual hcDNA levels and DNA size [9]US Food and Drug Administration. Guidance for Industry: Human Gene Therapy for Neurodegenerative Diseases. Oct 2022.. This shift is in line with development of gene therapy domain and especially AAV-based products for which non-specific encapsidation of hcDNA is known to be resistant to enzymatic degradation [10]Brimble MA, Winston SM, Davidoff AM. Stowaways in the cargo: contaminating nucleic acids in rAAV preparations for gene therapy. Mol. Ther. 2023; 31, 2826–2838. and also causing copurification due to similarity with the viral product, a phenomenon also acknowledged by the FDA [11]OTP Town Hall. Gene Therapy Chemistry, Manufacturing, and Controls. Zoom (zoomgov.com).. This evolution in guidelines reflects an increasingly nuanced regulatory approach that considers the complexities of modern gene therapies and the specific characteristics of different viral vector production systems.
To support organizations developing viral-based therapeutics in a changing regulatory landscape, BioPhorum initiated the Impurities in Viral-Based Therapeutics workstream which comprised of 34 members from 20 organizations.
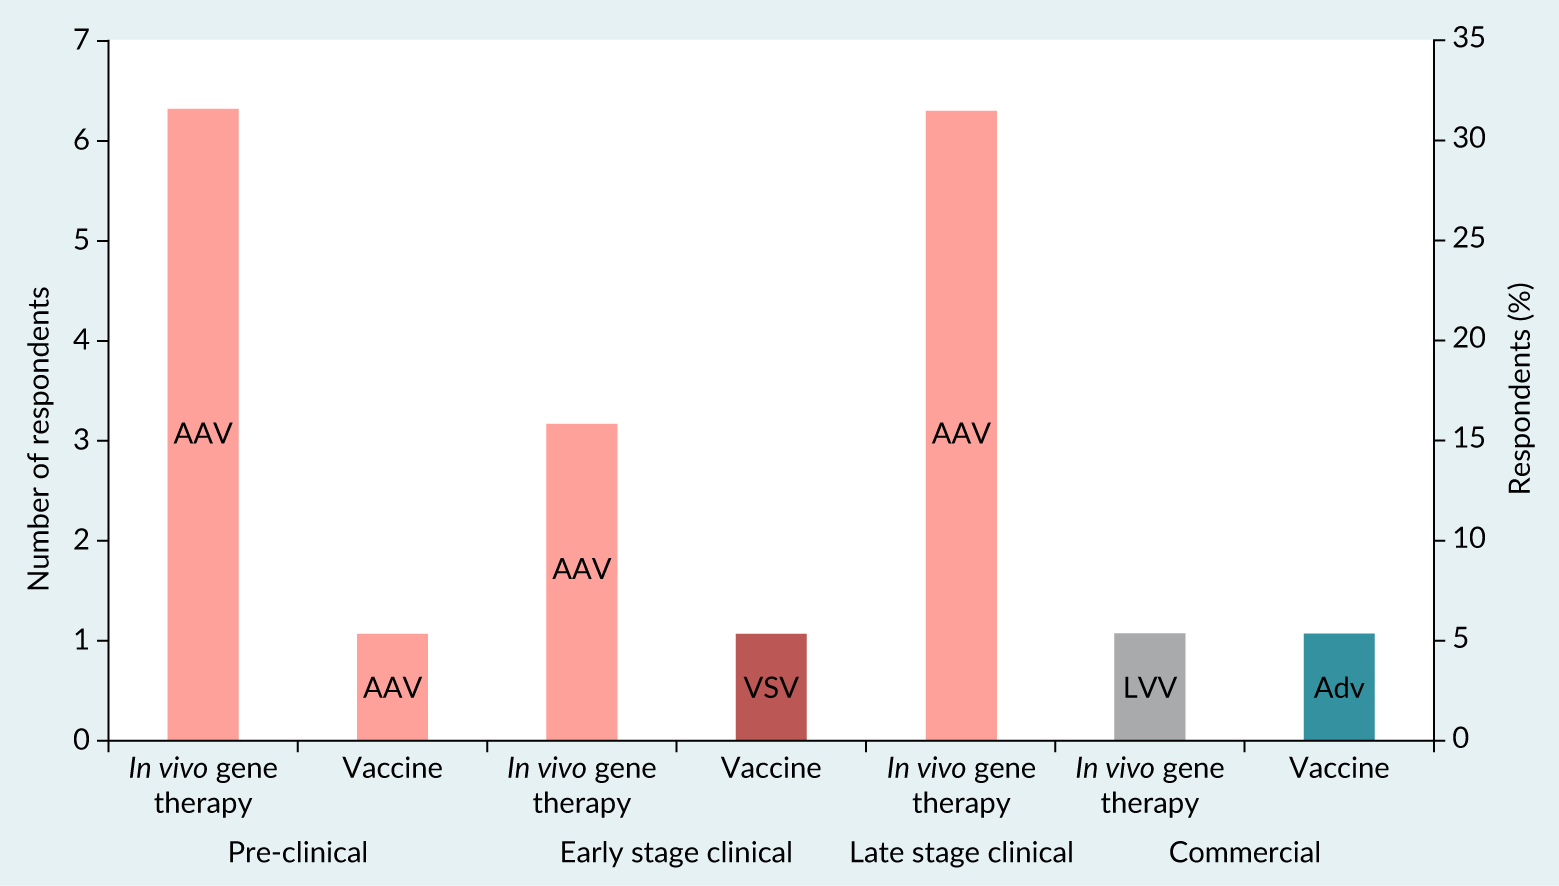
To assess the unmet need in this space, two benchmarking surveys were conducted to gather insights from individuals in the viral therapeutics industry. The first survey received 32 responses from 23 BioPhorum member companies and included questions relating to several process and product-related impurities. The second, hcDNA focused survey, received 22 responses from 16 BioPhorum member companies. It should be noted that some questions in the surveys were not mandatory, so the number of responses shown in figures, can be lower than total number of respondents. The surveyed companies primarily comprised AAV-focused entities (Figure 2). As a result, whilst the focus of this article is AAV gene therapy, many of the principles can be extrapolated to other viral vectors with similar cell lines and manufacturing processes.
| Figure 2. Summary of demographic from second BioPhorum member survey focussed on hcDNA. |
|---|
 |
hcDNA analysis methods
Accurate quantification of hcDNA is critical for effective monitoring and regulatory compliance. The biopharmaceutical industry primarily uses three methods: quantitative PCR (qPCR), digital PCR (dPCR, which includes ddPCR for the purposes of this article), and long-read next-generation sequencing (NGS) [12]Kontogiannis T, Braybrook J, McElroy C, et al. Characterization of AAV vectors: a review of analytical techniques and critical quality attributes. Mol. Ther. Methods Clin. Dev. 2024; 32, 101309..
For hcDNA quantification various PCR targets are commonly employed, including sequences specific to E1A, E1B, 18S, and Alu genes [13]Shmidt AA, Egorova TV. PCR-based analytical methods for quantification and quality control of recombinant adeno-associated viral vector preparations. Pharmaceuticals (Basel) 2021; 15, 23. [14]Wright JF. Product-related impurities in clinical-grade recombinant AAV vectors: characterization and risk assessment. Biomedicines 2014; 2, 80–97.. These sequences differ by the occurrence frequency in the genome and this directly affects sensitivity of the hcDNA quantification method (Table 1).
| Table 1. hcDNA method comparison summary. | |||
|---|---|---|---|
| Methodology | qPCR | dPCR | NGS |
| % of survey responses using for hcDNA quantification | 70% | 21% | 9% |
| Characteristics | Quantitative (relative); targeted approach; amplification measured at each cycle; data is collected at exponential phase | Quantitative (absolute); targeted approach; measures amplification at the end of PCR cycles; data subjected to Poisson statistics | Quantitative (relative); facilitates global sequencing of DNA; short-read and long-read sequencing possible |
| Advantages | High throughput analysis for larger number of samples; larger dynamic range | High throughput analysis for larger number of samples; high reproducibility; less affected by PCR amplification efficiency; higher PCR inhibitor tolerance [15]; no standard curve required, potentially reducing assay cost; DNA extraction step can be avoided for some sample types, i.e., post-affinity downstream processing samples generally do not show significant matrix effect; high sensitivity | Long-read—confirmation of long complex sequences; short-read—high accuracy; no a priori knowledge of target DNA material required |
| Disadvantages | A priori knowledge of target DNA material required; lower sensitivity; high variability (affected by PCR efficiency, selection of DNA extraction process); prone to PCR inhibitors; sensitive to matrix interference, DNA extraction step essential; requires standard curve | A priori knowledge of target DNA material required; conversion required to report in ng/mL | Low throughput; high cost; advanced computational analysis required |
qPCR
Real-time qPCR is a highly specific and sensitive test method to detect and quantitate residual hcDNA. According to BioPhorum’s survey, qPCR is the preferred technique for hcDNA quantification (70% of 16 respondents). This assay quantifies hcDNA content by comparing Ct or Cp values from the sample to a standard curve generated using genomic DNA (gDNA) from the target species.
Primary advantages of qPCR for hcDNA analysis are increased sensitivity in comparison to more traditional methods, like DNA-hybridization on a membrane or the Threshold® method and that it provides quantitative results directly as mass per reaction, eliminating the need for unit conversion [16]Vernay O, Sarcey E, Detrez V, et al. Comparative analysis of the performance of residual host cell DNA assays for viral vaccines produced in Vero cells. J. Virol. Methods 2019; 268, 9–16.. Furthermore, the method is recognized in several pharmacopeial guidelines, which outline regulatory expectations for controls, PCR efficiency, sensitivity, and acceptable DNA recovery [17]European Pharmacopoeia. Quantification and Characterisation of Residual Host-Cell DNA. Chapter 2.6.35. [18]United States Pharmacopeia. Nucleic Acid-Based Techniques—Approaches for Detecting Trace Nucleic Acids (Residual DNA Testing) and Residual DNA Testing (rResidual CHO and E. coli DNA). Chapters 1130 and 509. [19]Chinese Pharmacopoeia. Determination of Residual Extraneous DNA. Chapter 3407..
Method sensitivity is influenced by the selected target sequence; for instance, highly repetitive elements like Short Interspersed Nuclear Elements (SINE), e.g. aforementioned Alu sequences, can enhance sensitivity, but with regard to human residual DNA detection may increase the risk of contamination from environmental sources, such as the laboratory personnel, which may lead to a falsification of the sample result and increases the risk for positive results in negative controls.
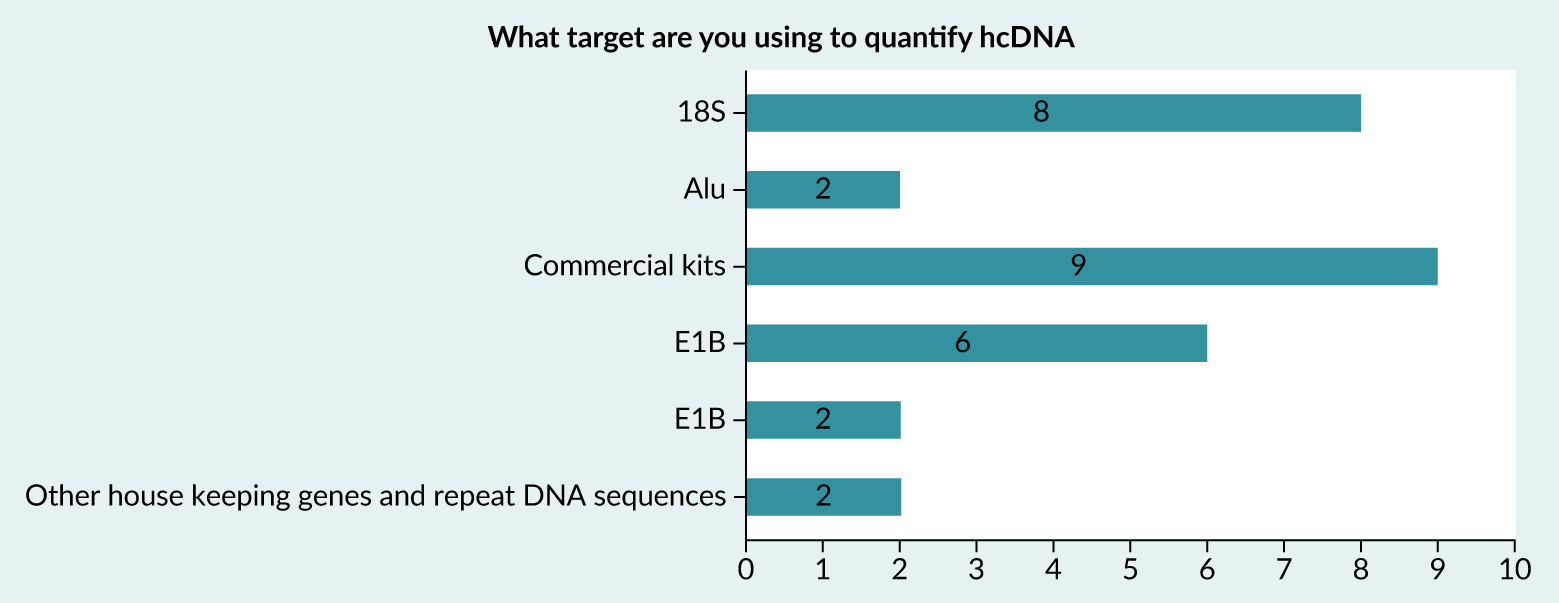
BioPhorum’s survey indicates that the 18S ribosomal RNA gene is among the most frequently used targets for human hcDNA quantification, aside from commercial kits (Figure 3).
| Figure 3. Summary of responses to BioPhorum survey relating to the target used to quantify hcDNA. |
|---|
 |
Additionally, for hcDNA, fragment size analysis should be included, as larger fragments (median of >200 bp) may present an increased risk of infectivity or oncogenicity, whereas with a median of <200 bp there is a lower risk to have the size of a functional gene. This may be facilitated by using two primer/probe sets or by using an independent method like capillary gel electrophoresis.
Total DNA isolation prior to PCR
Before qPCR, gDNA extraction from viral capsids is a crucial step to DNA profiling as qPCR is sensitive to matrix interference. In general, DNA extraction involves capsid protein digestion (i.e. with proteinase K), and lysis so that encapsidated DNA is also extracted. The DNA extraction methods may have a significant impact on the qPCR results [20]Đermić D, Ljubić S, Matulić M, et al. Reverse transcription-quantitative PCR (RT-qPCR) without the need for prior removal of DNA. Sci. Rep. 2023 Jul 15; 13, 11470. [21]Smith DL, Wu C, Gregorich S, et al. Impact of DNA extraction methods on quantitative PCR telomere length assay precision in human saliva samples. Int. J. Methodol. 2022 Dec; 1, 44–57.. The downstream chromatography purification of AAV products is insufficient to remove excess plasmid DNA (pDNA) from vector samples.
dPCR
dPCR is an alternative technique for quantifying hcDNA. Unlike qPCR, which measures amplified DNA in bulk, dPCR partitions the PCR reaction mixture, including the sample, into thousands of smaller reactions. Each “mini-PCR reaction” is analyzed individually, and the results are processed using Poisson statistics to determine the final copy number of the target gene. One of the key advantages of dPCR is its ability to provide absolute quantification [22]Higashiyama K, Yuan Y, Hashiba N, et al. Quantitation of residual host cell DNA in recombinant adeno-associated virus using droplet digital polymerase chain reaction. Hum. Gene Ther. 2023; 34, 578–585. of DNA copy numbers without relying on a standard curve, a limitation of traditional qPCR. Despite these benefits, a recent BioPhorum survey found that only about 20% of 16 respondents currently use dPCR.
One drawback is the longer time required for assay performing and data collection, compared to qPCR. Another challenge is that the dPCR reporting unit, copy number, is not directly aligned with regulatory threshold, which is expressed in ng/dose. In the study presented by FDA scientists in 2021 FDA Science Forum demonstrating the high sensitivity and high matrix effect tolerance of dPCR for quantifying hcDNA in drugs produced in E. coli [23]US Food and Drug Administration. Direct Analysis of Residual Host Cell DNA by Droplet Digital PCR (ddPCR) in Biologic Drugs Produced in E. coli. FDA Science Forum, 2021.. However, the study didn’t discuss how to convert the copy number results to mass values of the hcDNA. Hussain and Bowers described a method to convert DNA copy numbers to mass (in femtograms) using a conversion factor based on the inverse slope of the standard curve [24]Hussain M, Bowers J. A droplet digital PCR method for CHO host residual DNA quantification in biologic drugs. J. Anal. Pharm. Res. 2017; 4, 82–85. [25]Anderson J, Hussain M. A direct droplet digital PCR method for E. coli host residual DNA quantification. Pharmacol. Pharm. 2018; 9, 117–123. . Haiqing Yu further demonstrated that pre-treating gDNA with restriction enzymes as a reference material significantly improves the accessibility of reporter genes, resulting in a much more accurate conversion factor, going in line with previously published papers like Higashiyama et al., 2023, who demonstrated the beneficial impact of restriction enzymes on dPCR results when genomic DNA is targeted [22]Higashiyama K, Yuan Y, Hashiba N, et al. Quantitation of residual host cell DNA in recombinant adeno-associated virus using droplet digital polymerase chain reaction. Hum. Gene Ther. 2023; 34, 578–585. [26]Yu H. The critical role of conversion factor in quantitative determination of host cell DNA with dPCR. BipPharma Webinars, Feb 4, 2025.. However, in a recent BioPhorum survey, only 36% of 11 respondents reported using the restriction enzyme-pretreated DNA as the reference material.
NGS
NGS can be used to determine the presence of hcDNA in an AAV preparation by sequencing drug substance/product using both vector backbone together with gene of interest and host cell line genome libraries, allowing for identification of contaminating hcDNA sequences within the viral vector, providing a comprehensive analysis of purity and potential contaminants in the AAV sample.
When determining hcDNA content in AAV preparations, both Short-Read sequencing (SRS) and Long-Read sequencing (LRS) technologies have their advantages and limitations. SRS can be used for initial quantification, due to its high accuracy and throughput whereas LRS may then be used to resolve any ambiguous regions or verify complex rearrangements that are difficult to interpret with short reads alone.
Applying NGS data as an orthogonal analytical method, may aid optimisation of manufacturing process and comparability studies after making a process change. However, an assay validation for accuracy, precision, linearity, and limit of quantification will be necessary to establish a specific purpose of new method [12]Kontogiannis T, Braybrook J, McElroy C, et al. Characterization of AAV vectors: a review of analytical techniques and critical quality attributes. Mol. Ther. Methods Clin. Dev. 2024; 32, 101309..
The set of recommendations on establishment of a GMP identity assay for recombinant AAV drug product using SRS have been described by recently published paper by BioPhorum [27]BioPhorum. Recommendations for Establishing a Next-Generation Sequencing Method in a GMP Setting to Confirm the Identity of a Recombinant AAV (rAAV) Gene Therapy Drug Product. Jun 28, 2024.. The key parameters and practical advice to method development and validation of a transgene-specific identity assay using NGS workflows in a GMP environment have been provided. Similar approach may be leveraged to method development and validation of LRS technologies for applications to characterize gene therapy products and DNA impurities.
Current situation
Range of dose levels and routes
AAV are administered through various routes depending on the disease type, patient age, and vector serotype-specific properties. It was found from the survey responses that the predominant dose route is intravenous/systemic (32%), followed by intra ocular (21%), intramuscular (11%), intra brain tissue (11%) and intrathecal/CSF (cerebrospinal fluid) (5% of 19 respondents).
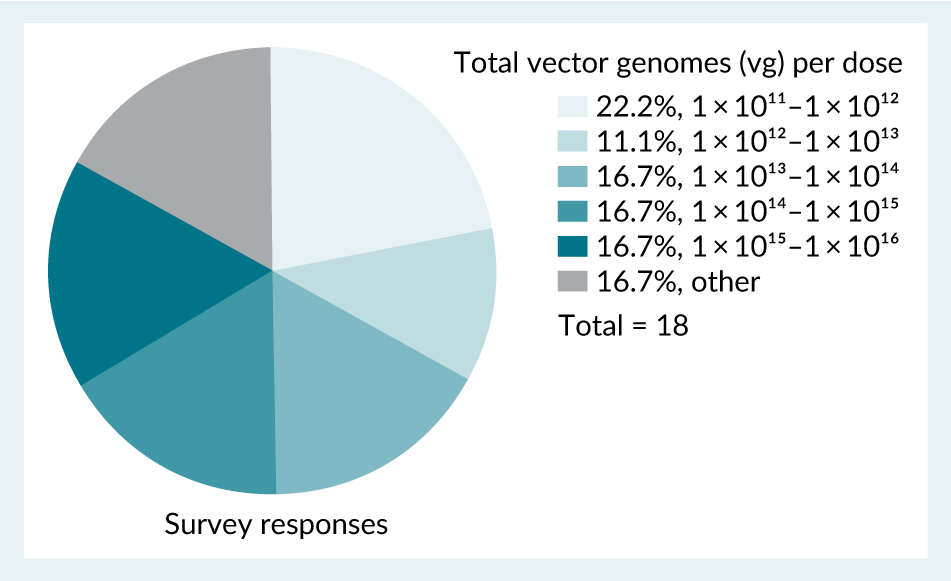
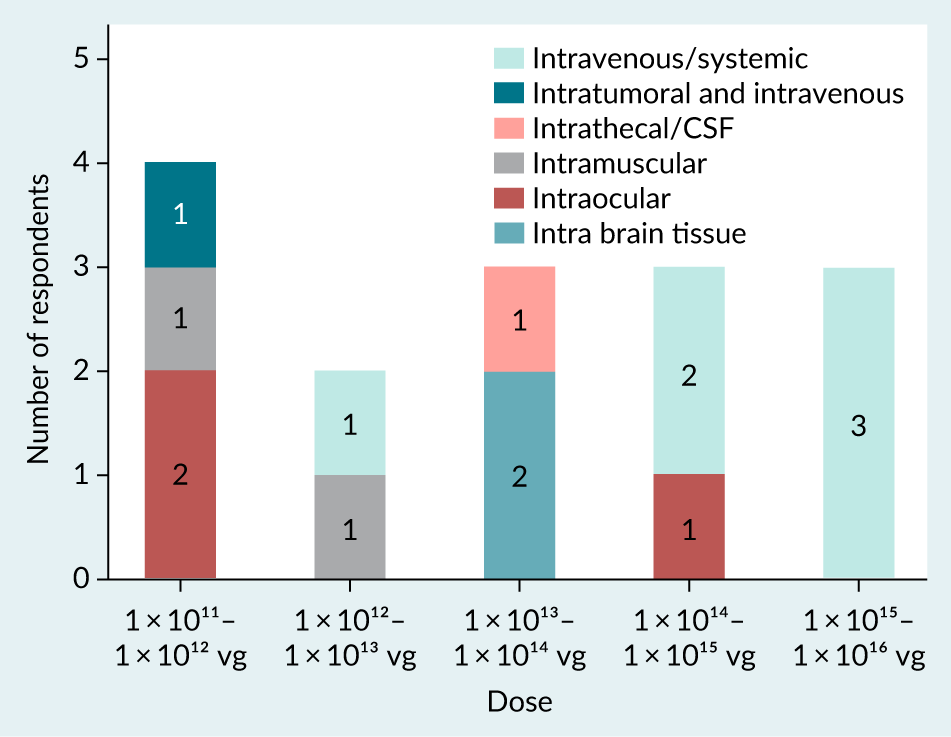
The dosing for AAV can vary significantly, spanning from 1 × 10¹¹ to 1 × 10¹⁶vg [28]Au HKE, Isalan M, Mielcarek M. Gene therapy advances: a meta-analysis of AAV usage in clinical settings. Front. Med. (Lausanne) 2022; 8, 809118., which is supported by the data gathered in the survey (Figure 4) and seen with commercial products [29]29.European Medicines Agency. Zolgensma summary of product characteristics. [30]Israeli Ministry of Health. [31]US Food and Drug Administration. [32]US Food and Drug Administration. [33]US Food and Drug Administration. [34]US Food and Drug Administration. . About 22% of 18 respondents from the survey used 1 × 10¹¹ to 1 × 10¹² range of total vg to administer to the patients. This was found to be the major range of vg dose administered. It should be considered that systemic and larger organ dose routes offer potential for a higher total vg dose (Figure 5).
| Figure 4. Survey responses indicating the range of total vector genomes (vg) administered per AAV product. |
|---|
 |
| Figure 5. Survey responses indicating the range of total vector genomes (vg) administered per AAV product across different dose routes. |
|---|
 |
Levels of hcDNA
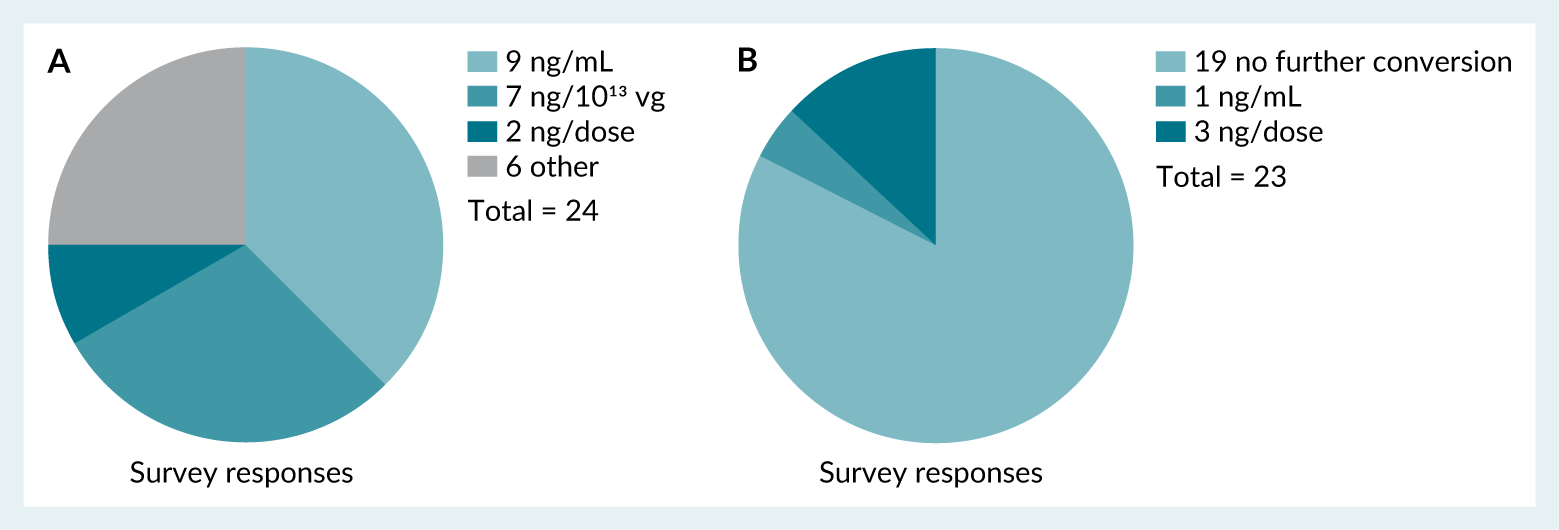
Reporting of hcDNA levels shows significant discrepancy through the industry. This discrepancy includes the units of reporting of hcDNA levels as demonstrated by the survey results (Figure 6A), which shows respondents use ng/mL, ng/ 1013vg, ng/dose as well as other units (ng/109 and ng/1012 vg) and 83% of 23 respondents made no further conversion of their reported results to other units (Figure 6B).
| Figure 6. A: Survey responses indicating the units used for reporting hcDNA results. Those responses that fall under ‘other’ include ng/ 10⁹ and ng/10¹² vg. B: Any other additional unit conversion used by respondents for reporting of hcDNA. |
|---|
 |
Survey respondents were asked to provide the range of hcDNA targeted in ng/dose in their respective drug products. 35% of 23 respondents indicated that a specific hcDNA target was unknown. The remaining 65% showed responses spanning multiple orders of magnitude, and only 35% indicating the WHO recommendation of ≤ 10 ng hcDNA/dose. It was hypothesized that the extremely broad distribution of hcDNA levels observed in initial survey responses, could be a function of the large dose level range as opposed to process and analytical capabilities. To confirm this hypothesis, a second survey was conducted in which respondents were asked to provide hcDNA levels normalized by vg (ng/1013vg).
The dataset obtained from the second survey consisted of 15 data points. Three extreme values were excluded as outliers, using the Tukey Outlier method (≥2700ng/1013vg), as they skewed the overall results. Figure 7 shows two box-and-whisker plots of the dataset before (Figure 7A) and after (Figure 7B) outlier exclusion. The post-outlier removal plot (Figure 7B) shows a more condensed distribution within the defined 95% confidence interval. This refined dataset presents a clearer view of typical hcDNA levels gathered in the survey.
| Figure 7. Box-and-whisker plots representing the dataset obtained from the second survey on hcDNA levels normalized by vg (ng/10¹³vg). A: Dataset before outlier exclusion. B: Dataset after outlier exclusion. |
|---|
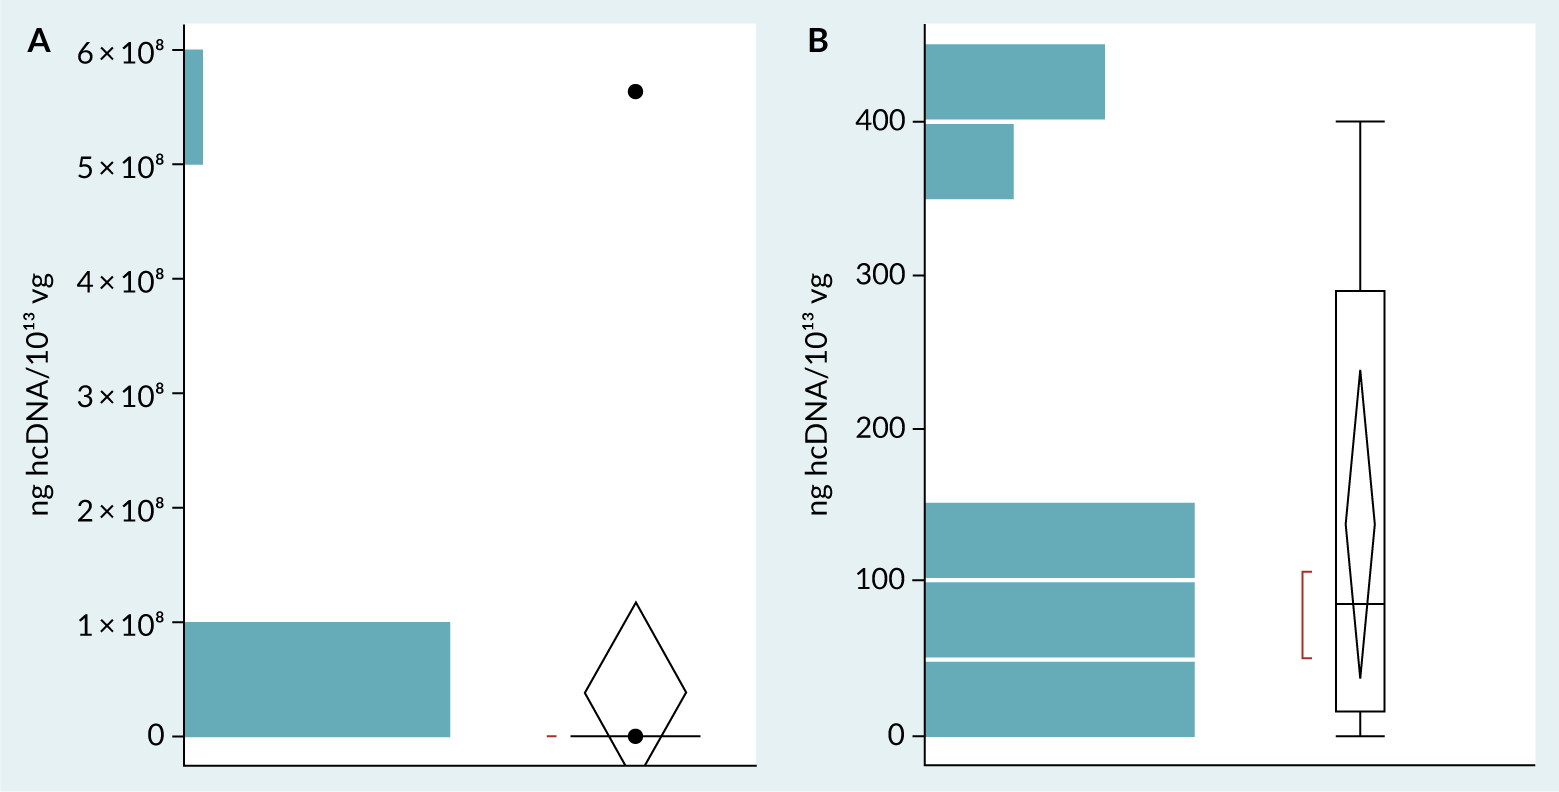 |
Table 2 shows the summary statistics calculated for the refined dataset obtained from the second survey. The mean at 137 ng hcDNA/1013vg serves as a central measure of typical hcDNA levels across samples. Considering the 95% confidence interval, it suggests that hcDNA values would likely fall between 39 and 235 ng/1013vg. This range provides a probabilistic benchmark for representative hcDNA levels. The results showed above indicate a possible consistent vg-normalized hcDNA level, and confirmed the hypothesis formulated after the first survey, that the broad range of hcDNA/dose was due to extremely broad dose ranges.
| Table 2. Summary statistics of the refined dataset of the benchmarking analysis. | ||
|---|---|---|
| Summary statistic | Result (ng hcDNA/10¹³ vg) | |
| Mean (average) | 137 | |
| Standard deviation | 154 | |
| Standard error mean | 44 | |
| 95% confidence interval | Upper bound | 235 |
| Lower bound | 39 | |
To further confirm this hypothesis, the vg-normalized hcDNA level distribution was used to create a model that predicts the percent of products that could achieve the WHO hcDNA limit of ≤10 ng hcDNA / dose as a function of total vg dosed. The resulting model (Figure 8) similarly confirmed the initial hypothesis, indicating that at the lower end of the dose range (1 × 10¹⁰ –1 × 10¹¹ vg/dose), > 80 % of products could achieve the WHO limit. Beyond this low dose range, a steep decline in the proportion of products capable of achieving the WHO limit was observed, with ≤20% of products capable of achieving < 10 ng hcDNA/dose at 1 × 10¹³vg or higher (Figure 8). These results were consistent with a prior independent assessment [5]Wright JF. Product-related impurities in clinical-grade recombinant AAV vectors: characterization and risk assessment. Biomedicines 2014; 2, 80–97..
| Figure 8. Bivariate Fit of Calculated % of programs achieving <10 ng hcDNA/dose By Total Vector Genomes Dosed. |
|---|
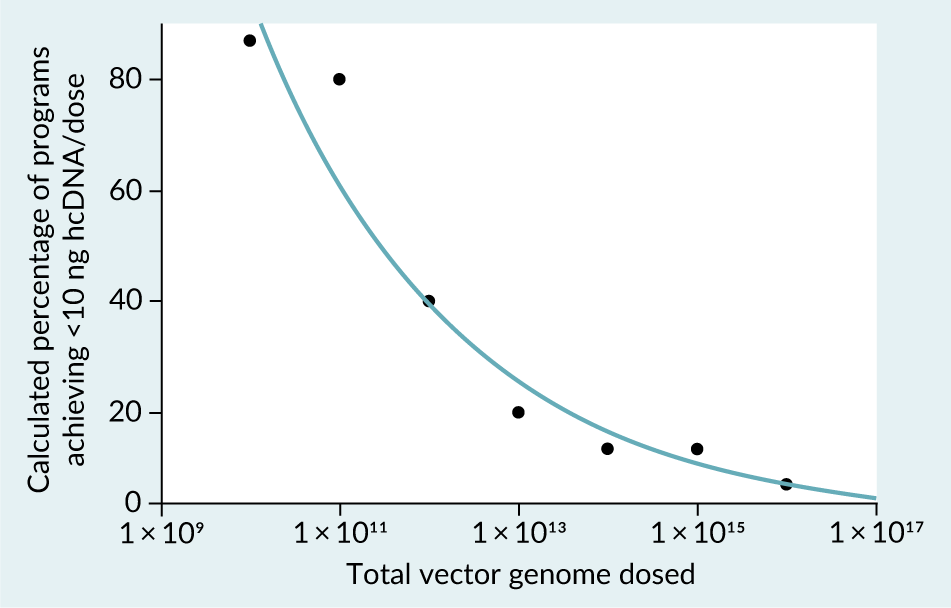 |
| The equation of the calculated regression line is Log(Calculated % of programs achieving <10 ng hcDNA/dose)=4.3101504– 0.1896496*Log(Total VG dosed), resulting in a R2 value of 0.958. |
It should be noted that the method (including analytical platform, sample preparation, standards and target sequence) used to assess hcDNA level may impact this assessment. Additionally, a low percentage of responses represented programs in late stage clinical or commercial applications (37% pre-clinical, 21% early-stage clinical trials, 32% late- stage clinical trials, 11% commercial programs of 19 respondents), which may skew the benchmark results towards higher hcDNA levels.
hcDNA control strategies
The presence of hcDNA in AAV preparations can occur in two distinct forms: encapsidated hcDNA and unencapsidated hcDNA. Encapsidated hcDNA consists of host cell genomic fragments that have been inadvertently packaged within AAV capsids. While packaging of DNA species without an AAV ITR region is likely less efficient given its key role in AAV genome packaging [35]Zhang J, Guo P, Xu Y, Mulcrone PL, Samulski RJ, Xiao W. “D” matters in recombinant AAV DNA packaging. Mol. Ther. 2021; 29(6), 1937–1939., the host cell DNA substrate exists in excess compared to vector genome DNA templates [5]Wright JF. Product-related impurities in clinical-grade recombinant AAV vectors: characterization and risk assessment. Biomedicines 2014; 2, 80–97. resulting in significant levels of hcDNA encapsidation.
It is well known that the production of viral vectors such as AAV and AdV, induce apoptosis and a molecular cascade involving caspase-activated DNase [36]Schmidt M, Afione S, Kotin RM. Adeno-associated virus type 2 Rep78 induces apoptosis through caspase activation independently of p53. J. Virol. 2000; 74, 9441–9450.. This leads to internucleosomal cleavage of DNA in fragments of 180 bp and multiples thereof (e.g., 360 bp, 540 bp, etc.) during the upstream process. Of the hcDNA present during AAV capsid formation, these smaller fragments are much more prone to be encapsidated than larger hcDNA fragments as these quickly exceed the virion’s packaging capacity [37]Hussong M, Kewes H. Reduction of encapsidated hcDNA during AAV production. Cell & Gene Therapy Insights 2024; 10, 1..
Finally, the level of encapsidated hcDNA is heavily dependent on the selected production system and upstream processing conditions as many existing downstream process steps for hcDNA clearance are primarily effective in clearing only unencapsidated species.
Upstream hcDNA control strategy
The following data around upstream control strategies were collected alongside the normalized hcDNA levels in this survey:
- production system
- whether starting materials were engineered to minimize hcDNA
- maximum and minimum viable cell densities
- end of production characteristics including cell viability and vg titer, and
- production stage duration
The data collected do not draw clear conclusions as no statistically significant correlations between survey responses and hcDNA levels were observed. While this may reflect the true nature of these production processes, it could also be due to the limited survey size. Therefore, process development studies of these and other process parameters may still be impactful.
Thorough screening of production systems that impact encapsidated hcDNA levels is particularly recommended for high dose applications [38]Trivedi PD, Yu C, Chaudhuri P, et al. Comparison of highly pure rAAV9 vector stocks produced in suspension by PEI transfection or HSV infection reveals striking quantitative and qualitative differences. Mol. Ther. Methods Clin. Dev. 2022; 24, 154–170. [39]Roach MK, Wirz P, Rouse J, et al. Production of recombinant adeno-associated virus 5 using a novel self-attenuating adenovirus production platform. Mol. Ther. Methods Clin. Dev. 2024; 32, 101320.. Additionally, the level of hcDNA degradation by caspase-activated DNase as well as the level of hcDNA encapsidation depends on various process parameters and/or material attributes determined by process characterization studies. Alternatively, the CCL could be genetically manipulated to reduce hcDNA encapsidation during AAV production [37]Hussong M, Kewes H. Reduction of encapsidated hcDNA during AAV production. Cell & Gene Therapy Insights 2024; 10, 1..
While direct understanding of the impact of upstream processing steps influencing the encapsidation of hcDNA is still in nascent stages, it is anticipated that new production strategies to reduce hcDNA level will emerge. A number of effective approaches for the clearance of unencapsidated hcDNA are discussed in ‘Downstream hcDNA control strategy’. However the total amount of process hcDNA generated during the upstream production will influence the downstream purification. It is therefore desirable to minimize the hcDNA impurity level where possible. Encapsidated hcDNA clearance during the downstream purification is non-specific, leading to full capsid removal as well, resulting in loss of yields.
Downstream hcDNA control strategy
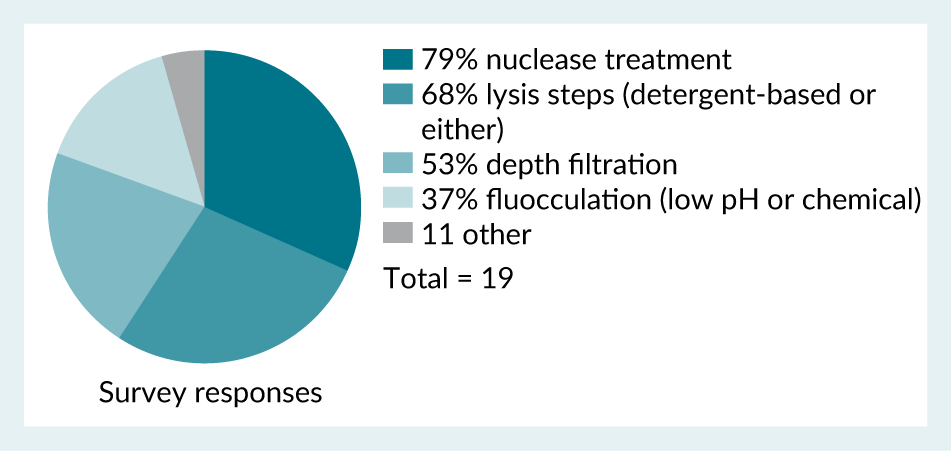
It was found from the survey (Figure 9) that respondents expected various process steps, conditions and addition of materials to have an impact on hcDNA levels. This included the temperature and duration of nuclease treatment, type of detergents used, pH, addition of salts, lysis buffers and MgCl₂, ultracentrifugation, ultrafiltration/diafiltration and modification of full/empty separation steps.
| Figure 9. Survey responses when asked what techniques are used during harvest and clarification steps that may impact hcDNA levels. |
|---|
 |
Once encapsidated, hcDNA becomes challenging to remove since it resides within the AAV capsid. AAV capsids containing hcDNA often biophysically (e.g., size, density and surface charge) resemble the AAV product (i.e., fully packaged AAV capsids containing the intended therapeutic genome), implying that they cannot be separated from the AAV product by any of the conventional purification techniques that are based on biophysical attributes such as size, charge or density. In contrast, non-encapsidated species are generally considered to be accessible for various purification strategies.
Thus, purification strategies for reduction of hcDNA in AAV manufacturing are primarily focused on clearance of unencapsidated hcDNA. A commonly used method to degrade hcDNA is treatment of harvest and/or other product intermediates with a nuclease to digest the hcDNA species [40]Srivastava A, Mallela KMG, Deorkar N, Brophy G. Manufacturing challenges and rational formulation development for AAV viral vectors. J. Pharm. Sci. 2021; 110, 2609–2624.. Nuclease digestion of nucleic acid impurities is well established as a highly effective and robust step for this purpose. However, it is frequently cited as a significant contributor to high manufacturing costs for AAV production. There are also methods to clear unencapsidated hcDNA during harvest and clarification steps. Treatment of AAV production harvest at low pH to hydrolyse nucleic acid species prior to clarification allows substantial clearance of not only hcDNA, but also reduction of host cell protein impurities [41]Heldt CL. Scalable method utilizing low pH for DNA removal in the harvest of recombinant adeno-associated virus vectors. J. Chromatography. B Analyt. Technol. Biomed. Life Sci. 2019; 1124, 173–179.. Additionally, techniques to utilize chromatographic clarification filters in place of traditional depth filters to reduce hcDNA species show promise in removal of nuclease treatment steps from AAV production processes [42]Thakur G, Mink S, Bak H, Tustian AD. Single-use chromatographic clarification to eliminate endonuclease treatment in production of recombinant adeno-associated viral vectors. Sep. Purif. Technol. 2025; 354.. Additional clearance may occur during downstream purification steps such as affinity, ion exchange, and/or ultrafiltration steps, but level of clearance can vary substantially as a function of the level of clearance observed over harvest and clarification steps. Encapsidated hcDNA has been identified in not only full capsids but also intermediate and, to a lesser extent, empty capsids [43]McColl-Carboni A, Dollive S, Laughlin S, et al. Analytical characterization of full, intermediate, and empty AAV capsids. Gene Ther. 2024; 31, 285–294.. This indicates the theoretical possibility that full capsid enrichment steps could contribute to additional clearance of encapsidated hcDNA via clearance of intermediate and empty capsids, though this correlation is not consistently captured in literature. The survey performed for this work included collection of information on downstream control strategies alongside the normalized hcDNA data to determine whether any industry-wide trends could be ascertained, including:
- harvest and clarification strategies,
- use of nuclease at harvest or other process intermediate,
- product capture step technique, and
- full/empty capsid separation step technique
Similar to upstream process conditions, no statistically significant trends were observed in this analysis, though a controlled experiment directly comparing these strategies could provide more insight into the impact of downstream process conditions on hcDNA level.
Overall, for definition of a process control strategy for hcDNA it is recommended that risk assessments be performed early in clinical development to determine a process development path. Generally speaking, the upstream and downstream controls for hcDNA levels are deemed sufficient to enable dosing with hcDNA maintained below the WHO established limit for “low dose” in vivo AAV gene therapies, defined in this work as < 1 × 10¹³ total vg, and thus low risk. Programs requiring higher doses, often accompanied by higher hcDNA levels, should consider extended time for evaluation of manufacturing strategies that reduce hcDNA levels, particularly those focused on preventing non-discriminant hcDNA packaging including novel production systems. Enhanced characterization of hcDNA species present should also be considered at high dose levels.
Analytical hcDNA control strategy
As discussed above, hcDNA can be controlled by having a low amount, degrading it and/or making it inactive. In ‘hcDNA analysis methods’ various analytical tools are identified, which can confirm the amount and possible degradation.
Either of the qPCR and dPCR methods could be part of the release panel to confirm the amount of extraneous hcDNA present. A common, and well accepted by HAs, practice for biological products is that hcDNA removal (spiking performed if needed) studies are executed and that consistent hcDNA removal is confirmed during process performance qualification (PPQ). If this consistent hcDNA removal is demonstrated, often no hcDNA quantification test is required as part of the release panel [9]US Food and Drug Administration. Guidance for Industry: Human Gene Therapy for Neurodegenerative Diseases. Oct 2022.. However, post-approval monitoring may still be requested for a certain number of batches dependent on the route of administration and amount of hcDNA administered.
According to the BioPhorum survey, 58% of 19 respondents monitor the size of hcDNA amplicons, and half of the respondents reported that up to 40% of their total hcDNA consisted of fragments larger than 200 bp. PCR methods, agarose gel and long range NGS can be applied to assess size distribution. Careful consideration should be made if such a control is required depending on the amount of extraneous hcDNA present. If based on the indication, dosage and the route of administration the amount of extraneous hcDNA is deemed too high, a certain level of hcDNA reduction and/or degradation may be required from a safety perspective. This can be assessed based on supportive characterization studies.
If a CCL is chosen, the oncogenicity and/or infectivity of possible genes (e.g., E1A/E1B in HEK 293 cell line) needs to be evaluated. A specific qPCR or dPCR method may be required then as part of release unless a correlation can be demonstrated between removal and/or degradation of those specific genes (including potentially encapsidated) and total hcDNA. This is likely the case as the removal and/or degradation is often non-specific.
Of note, during development it is standard practice that a quantitative hcDNA method is part of the release panel and hcDNA size and oncogene/infectivity genes quantification methods are part of the characterization panel. Furthermore, the hcDNA analytical control strategy is also dependent on the indication, dosage and the route of administration.
For reasons of safety, it is crucial to understand what hcDNA is encapsidated. This can be assessed via NGS with, e.g., appropriate separation prior to the sequencing so that only the encapsidated hcDNA is sequenced. A risk assessment can be performed to determine if any intact oncogenes or infectivity genes are carried over and assess their potential impact on safety. Based on the outcome of the risk assessment certain manufacturing process and/or analytical controls may be required.
Oncogenicity studies can be performed for a CCL to determine if it is oncogenic based on various residual hcDNA concentrations [44]US Food and Drug Administration. Vaccines and Related Biological Products Advisory Committee Meeting–Cell Lines Derived from Human Tumors for Vaccine Manufacture. Sept 19, 2012.. These data can then be extrapolated to determine toxicological levels for specific oncogenes/infectivity genes based on how many gene copies are present, the size of the genome and the amount of residual hcDNA injected which did not cause tumor formation. Such studies were previously performed for the PER.C6 cell line [45]Ledwith BJ, Lanning CL, Gumprecht LA, et al. Tumorigenicity assessments of Per.C6 cells and of an Ad5-vectored HIV-1 vaccine produced on this continuous cell line. Dev. Biol. (Basel) 2006; 123, 251–263., which was constructed in a similar fashion as the HEK293 cell line [46]Fallaux FJ, Bout A, van der Velde I, et al. New helper cells and matched early region 1-deleted adenovirus vectors prevent generation of replication-competent adenoviruses. Hum. Gene Ther. 1998; 9, 1909–1917..
Infectivity, i.e., the presence of retrovirus genome in the host cell DNA, can be assessed by assessing the presence of endogenous and/or latent retroviruses in the cell bank. To thoroughly demonstrate that there are no retroviruses endogenously present in the cell bank, a fluorescent product enhanced reverse transcriptase (F-PERT) assay can be conducted on the cell bank. The presence of latent retroviruses can be assessed by chemical induction with 5-iodo-2-deoxyuridine (IdU) or 5azacytidine (AzaC) followed by co-cultivation with detector cells and F-PERT, as well as transmission electron microscopy (TEM).
Translation insight
Proposal for harmonized reporting approach
As shown through the benchmarking surveys presented in this work, assessment of hcDNA levels in AAV-based in vivo gene therapies represents a challenge particularly for high dose applications (i.e. ≥ 1 × 10¹³ vg/dose). Administration of dose levels with differences across many orders of magnitude have resulted in an unclear understanding of what is achievable with respect to hcDNA levels, limiting practical assessment of hcDNA-related risks early in clinical or even pre-clinical development.
Given the regulatory expectation that hcDNA levels should be justified in a product-specific manner, particularly in scenarios where hcDNA levels result in >10 ng hcDNA administered per dose, it is likely that a significant number of in vivo gene therapy programs will independently need to justify hcDNA levels above the historical WHO limit. It is implicit that for any individual program, the total hcDNA dosed along with characterization of the hcDNA impurities species present is the most relevant means of assessing the safety risk for patients.
In cases involving rare and ultra-rare diseases where potentially revolutionary treatments are being developed for populations with significant unmet needs, there may be situations where the considerable benefits outweigh the increased risks posed by high impurity levels, resulting in an overall improvement for patient communities. In these scenarios, manufacturers should aim development to minimize hcDNA levels and other impurities to the extent feasible by the existing industry best practices for AAV manufacturing. While the industry benchmark cannot and should not be used independently from established safety data or total hcDNA levels dosed for a particular manufacturing process, it can aid in determining whether drug substance or drug product hcDNA levels could feasibly be reduced further with targeted process development. When further reduction in hcDNA levels is improbable through additional process development, the industry benchmark can serve as a valuable support for a current process range, unless new innovations emerge to challenge established best practices.
Second, a key challenge in innovation and process improvement for in vivo gene therapies is identifying when real improvements above existing best practices are observed. In the context of process improvements that reduce hcDNA, head-to-head comparisons of hcDNA levels on a per dose basis across multiple manufacturing processes where dosing can vary by multiple orders of magnitude does not allow for true assessment of overall process capabilities. As a result, proposed novel process improvements that aim to reduce hcDNA or other process impurity levels are limited to assessing fold-changes without reference to an industry benchmark. This limitation reduces the ability to identify whether improvements are observed in real-world applications. Given the need for elevated dosing levels, coupled with the low likelihood of achieving <10 ng hcDNA/dose at and above 1 × 10¹³ total vg dosed, further innovation in this arena could provide strong impact to patient communities, and potentially improve safety profiles such that higher dosing to improve effectiveness could potentially be enabled through lower risk from high hcDNA level.
In support of this justification, harmonizing reporting industry-wide to not only include total hcDNA per dose administered, but also normalized hcDNA level per vg will allow head-to-head comparisons of levels measured (encompassing hcDNA generation, encapsidation and associated clearance and degradation) for a specific manufacturing process compared to the established industry benchmark. The proposed calculation for vg-normalized hcDNA level is shown in the following equation:

Combining this assessment with safety assessments in regulatory submissions can strengthen justification, particularly if normalized hcDNA levels are within or below the industry benchmark (39-235 ng/1013vg). As differences in analytical procedures used for quantification of hcDNA and vg could contribute to the variability observed across these harmonised measurements, industry standardization in analytical procedure may further support comparisons.
Furthermore, continued efforts to innovate novel means to reduce hcDNA levels in AAV preparations can broadly benefit from enabling vg-normalized hcDNA comparisons to ensure that any reduction in hcDNA levels are not a result of either final vector concentration or total vector modelled for administration.
References
1. Tan E, Chin CSH, Lim ZFS, et al. HEK293 Cell line as a platform to produce recombinant proteins and viral vectors. Front. Bioeng. Biotechnol. 2021; 9, 796991. Crossref
2. US Food and Drug Administration. Characterization and Qualification of Cell Substrates and Other Biological Materials Used in the Production of Viral Vaccines for Infectious Disease Indications. FDA Center for Biologics Evaluation and Research; 2010. Crossref
3. Temin HM. Overview of biological effects of addition of DNA molecules to cells. J. Med. Virol. 1990; 31, 13–17. Crossref
4. US Food and Drug Administration. Briefing Document: Vaccines and Related Biological Products Advisory Committee Meeting. Sep 19, 2012. Crossref
5. Wright JF. Product-related impurities in clinical-grade recombinant AAV vectors: characterization and risk assessment. Biomedicines 2014; 2, 80–97. Crossref
6. WHO. Requirements for the use of animal cells as in vitro substrates for the production of biologicals. Biologicals 1998; 26, 175. Crossref
7. World Health Organization. Annex 3: Recommendations for the Evaluation of Animal Cell Cultures as Substrates for the Manufacture of Biological Medicinal Products and for the Characterization of Cell Banks. Replacement of Annex 1 of WHO Technical Report Series, No. 878, 2013. Crossref
8. US Food and Drug Administration. Guidance for Industry: Characterization and Qualification of Cell Substrates and Other Biological Materials Used in the Production of Viral Vaccines for Infectious Disease Indications. FDA Center for Biologics Evaluation and Research, Feb 2010. Crossref
9. US Food and Drug Administration. Guidance for Industry: Human Gene Therapy for Neurodegenerative Diseases. Oct 2022. Crossref
10. Brimble MA, Winston SM, Davidoff AM. Stowaways in the cargo: contaminating nucleic acids in rAAV preparations for gene therapy. Mol. Ther. 2023; 31, 2826–2838. Crossref
11. OTP Town Hall. Gene Therapy Chemistry, Manufacturing, and Controls. Zoom (zoomgov.com). Crossref
12. Kontogiannis T, Braybrook J, McElroy C, et al. Characterization of AAV vectors: a review of analytical techniques and critical quality attributes. Mol. Ther. Methods Clin. Dev. 2024; 32, 101309. Crossref
13. Shmidt AA, Egorova TV. PCR-based analytical methods for quantification and quality control of recombinant adeno-associated viral vector preparations. Pharmaceuticals (Basel) 2021; 15, 23. Crossref
14. Wright JF. Product-related impurities in clinical-grade recombinant AAV vectors: characterization and risk assessment. Biomedicines 2014; 2, 80–97. Crossref
15. Sidstedt M, Rådström P, Hedman J. PCR inhibition in qPCR, dPCR and MPS-mechanisms and solutions. Anal. Bioanal. Chem. 2020; 412, 2009–2023. Crossref
16. Vernay O, Sarcey E, Detrez V, et al. Comparative analysis of the performance of residual host cell DNA assays for viral vaccines produced in Vero cells. J. Virol. Methods 2019; 268, 9–16. Crossref
17. European Pharmacopoeia. Quantification and Characterisation of Residual Host-Cell DNA. Chapter 2.6.35. Crossref
18. United States Pharmacopeia. Nucleic Acid-Based Techniques—Approaches for Detecting Trace Nucleic Acids (Residual DNA Testing) and Residual DNA Testing (rResidual CHO and E. coli DNA). Chapters 1130 and 509. Crossref
19. Chinese Pharmacopoeia. Determination of Residual Extraneous DNA. Chapter 3407. Crossref
20. Đermić D, Ljubić S, Matulić M, et al. Reverse transcription-quantitative PCR (RT-qPCR) without the need for prior removal of DNA. Sci. Rep. 2023 Jul 15; 13, 11470. Crossref
21. Smith DL, Wu C, Gregorich S, et al. Impact of DNA extraction methods on quantitative PCR telomere length assay precision in human saliva samples. Int. J. Methodol. 2022 Dec; 1, 44–57. Crossref
22. Higashiyama K, Yuan Y, Hashiba N, et al. Quantitation of residual host cell DNA in recombinant adeno-associated virus using droplet digital polymerase chain reaction. Hum. Gene Ther. 2023; 34, 578–585. Crossref
23. US Food and Drug Administration. Direct Analysis of Residual Host Cell DNA by Droplet Digital PCR (ddPCR) in Biologic Drugs Produced in E. coli. FDA Science Forum, 2021. Crossref
24. Hussain M, Bowers J. A droplet digital PCR method for CHO host residual DNA quantification in biologic drugs. J. Anal. Pharm. Res. 2017; 4, 82–85. Crossref
25. Anderson J, Hussain M. A direct droplet digital PCR method for E. coli host residual DNA quantification. Pharmacol. Pharm. 2018; 9, 117–123. Crossref
26. Yu H. The critical role of conversion factor in quantitative determination of host cell DNA with dPCR. BipPharma Webinars, Feb 4, 2025. Crossref
27. BioPhorum. Recommendations for Establishing a Next-Generation Sequencing Method in a GMP Setting to Confirm the Identity of a Recombinant AAV (rAAV) Gene Therapy Drug Product. Jun 28, 2024. Crossref
28. Au HKE, Isalan M, Mielcarek M. Gene therapy advances: a meta-analysis of AAV usage in clinical settings. Front. Med. (Lausanne) 2022; 8, 809118. Crossref
29. 29.European Medicines Agency. Zolgensma summary of product characteristics. Link
30. Israeli Ministry of Health. Link
31. US Food and Drug Administration. Link
32. US Food and Drug Administration. Link
33. US Food and Drug Administration. Link
34. US Food and Drug Administration. Link
35. Zhang J, Guo P, Xu Y, Mulcrone PL, Samulski RJ, Xiao W. “D” matters in recombinant AAV DNA packaging. Mol. Ther. 2021; 29(6), 1937–1939. Crossref
36. Schmidt M, Afione S, Kotin RM. Adeno-associated virus type 2 Rep78 induces apoptosis through caspase activation independently of p53. J. Virol. 2000; 74, 9441–9450. Crossref
37. Hussong M, Kewes H. Reduction of encapsidated hcDNA during AAV production. Cell & Gene Therapy Insights 2024; 10, 1. Crossref
38. Trivedi PD, Yu C, Chaudhuri P, et al. Comparison of highly pure rAAV9 vector stocks produced in suspension by PEI transfection or HSV infection reveals striking quantitative and qualitative differences. Mol. Ther. Methods Clin. Dev. 2022; 24, 154–170. Crossref
39. Roach MK, Wirz P, Rouse J, et al. Production of recombinant adeno-associated virus 5 using a novel self-attenuating adenovirus production platform. Mol. Ther. Methods Clin. Dev. 2024; 32, 101320. Crossref
40. Srivastava A, Mallela KMG, Deorkar N, Brophy G. Manufacturing challenges and rational formulation development for AAV viral vectors. J. Pharm. Sci. 2021; 110, 2609–2624. Crossref
41. Heldt CL. Scalable method utilizing low pH for DNA removal in the harvest of recombinant adeno-associated virus vectors. J. Chromatography. B Analyt. Technol. Biomed. Life Sci. 2019; 1124, 173–179. Crossref
42. Thakur G, Mink S, Bak H, Tustian AD. Single-use chromatographic clarification to eliminate endonuclease treatment in production of recombinant adeno-associated viral vectors. Sep. Purif. Technol. 2025; 354. Crossref
43. McColl-Carboni A, Dollive S, Laughlin S, et al. Analytical characterization of full, intermediate, and empty AAV capsids. Gene Ther. 2024; 31, 285–294. Crossref
44. US Food and Drug Administration. Vaccines and Related Biological Products Advisory Committee Meeting–Cell Lines Derived from Human Tumors for Vaccine Manufacture. Sept 19, 2012. Crossref
45. Ledwith BJ, Lanning CL, Gumprecht LA, et al. Tumorigenicity assessments of Per.C6 cells and of an Ad5-vectored HIV-1 vaccine produced on this continuous cell line. Dev. Biol. (Basel) 2006; 123, 251–263. Crossref
46. Fallaux FJ, Bout A, van der Velde I, et al. New helper cells and matched early region 1-deleted adenovirus vectors prevent generation of replication-competent adenoviruses. Hum. Gene Ther. 1998; 9, 1909–1917. Crossref
Affiliations
Reshma Sundar, Xue Mi, and Yong-Syu Lee*, AbbVie; Simon Walker, BioPhorum; Ashton Lavoie, formerly of Bridge Bio Gene Therapy; Ane Quesada Ganuza and Suna Lipp, Bayer; Marija Brgles, Boehringer Ingelheim; Hunter Walker*, BridgeBio Gene Therapy; Denise Teber, Charles River Laboratories; Steven Henry, Eurofins BioPharma Product Testing; Ashoka Maddur, FUJIFILM Biotechnologies; Pepijn Burgers, Qirong Wu*, Johnson & Johnson; Beata Adamiak, Spyridon Gerontas*, Pharmaron; Victor Chen, REGENXBIO; Roland Pach, Roche; Haiqing Yu, Sanofi; Ying Zhang*, Sarepta Therapeutics; Sophie Cheverry*, SK Pharmteco (EU); Kate Groves, Nic Preyat, Parag Kumthekar, and Ishtiaq Khaliq*, UCB
*Contributing authors
Authorship & Conflict of Interest
Contributions: The named author takes responsibility for the integrity of the work as a whole, and has given their approval for this version to be published.
Acknowledgements: None.
Disclosure and potential conflicts of interest: Ashton Lavoie has one pending existing patent unrelated to current publication (Methods of Preparing Gene Therapies US20240002812A1), and holds stock in BridgeBio and Tectonic Therapeutic, Inc. Ying Zhang is a scientific committee member of BEBPA and holds stock options granted from Sarepta Therapeutics.
Funding declaration: Ashton Lavoie participated in workstream through BridgeBio membership.
Article & Copyright Information
Copyright: Published by Cell & Gene Therapy Insights under Creative Commons License Deed CC BY NC ND 4.0 which allows anyone to copy, distribute, and transmit the article provided it is properly attributed in the manner specified below. No commercial use without permission.
Attribution: Copyright © 2025 BioPhorum Operations Group Ltd. Published by Cell & Gene Therapy Insights under Creative Commons License Deed CC BY NC ND 4.0.
Article source: Invited; externally peer reviewed. Link is here.
Submitted for peer review: Jul 10, 2025.
Revised manuscript received: Aug 8, 2025.
Publication date: Oct 16, 2025.